top of page

The Q wave
The Q wave can cause consternation sometimes because it represents several different things.
I think this confusion stems from the fact that there is both the expected ECG appearance under normal circumstances, and how it can appear in abnormal circumstances.
Under normal circumstances, physiologically speaking the Q wave represents the depolarisation of the interventricular septum.
One key physiological factor to this is that the interventricular septum is ONLY innervated by the left bundle branches.
This is therefore the result:

If the candidate wishes to ask me WHY the interventricular septum is only innervated by the left bundles, as opposed to the right bundles which run superficially along it, I will simply answer that this is a really good question, and they should direct it to someone clever.
I.E: Not me.
What this does mean though is that we can extrapolate what "should" reflect normalcy and why.
Amending an old image:

Because the initial depolarisation is from left to right, (as per blue arrows above)
The anterior leads should therefore ALWAYS see this as a positive waveform.
Here is an example of a normal sinus rhythm ECG. Observe the (lack of) anterior Q waves

Their presence thus implies something has gone wrong with the depolarisation of the interventricular septum.
By definition the Q wave has to be negative in its polarity. This is also why there should never be anterior Q waves.
Q waves - normal or abnormal?

The notion of "Q" induces a sense of forboding in both starfleet captains and in cardiologists.
Strictly speaking, one should make the distinction between "abnormal" vs "normal" Q waves.
As discussed earlier, the presence of Q waves is entirely unconcerning in most leads.
On the other hand, saying "there are abnormal anterior Q waves" is tautology - as by definition, anterior Q waves ARE abnormal.
To add fuel to the fire, the lack of Q waves can also be considered abnormal in the lateral leads.

Given the initial depolarisation if from left to right, we therefore should expect a negative deflection in leads I, aVL, V5, V6.
Therefore, an absence of such a negative deflection should raise an index of suspicion for abnormality.
This can be seen in instances of MI, or indeed in LBBB.

So where does that leave us?
The above can essentially be neatly summarised into a table as follows:
(Awaiting permission from author to insert summary image here, but in the interim CLICK HERE for link to a website which hosts said image)
If like the author you are instead paranoid about where your information comes from, then the answer to that is this lovely paper from 1982.

You should be able to obtain it through your own institution, as for obvious copyright reasons pasting its relevant contents here is not good for my academic health.
although it is worth noting that the paper was done in the pre-PPCI era, its analysis of Q wave patterns remains relevant and valid.
Likewise, besides the location of the Q wave on the 12 lead ECG being a determinant as to it's pathological nature or not, came the rest of the criteria:
>40ms wide
>2mm deep
>25% the depth of the QRS complex
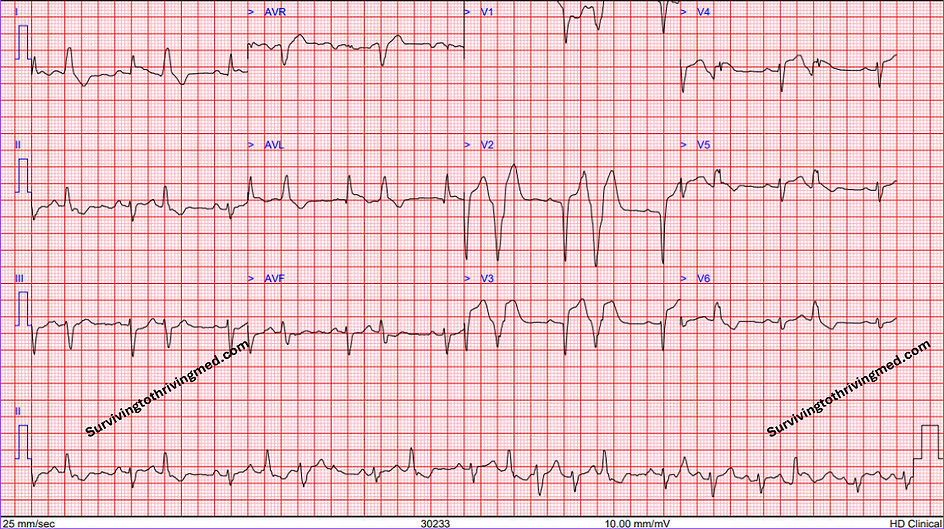
This can be demonstrated in an ECG like the following, with the oft quoted "dagger Q wave"

The final question of why the "dagger" moniker was chosen, as opposed to any other dangerous sharp pointy object like a stiletto, pin or infection control nurse is unknown.
Onto the R wave:

bottom of page