top of page

Part 4: Axis calculation
If one recalls that that the leads can only "see" in positive and negative vectors, then we can use this to determine the axis of the heart.
Whilst there are many reported ways of doing so, this is often regrettably relegated to phrases such as certain leads "Reaching" or "Leaving" each other.
My preferred approach is the quadrant approach, as it only requires two leads (Lead I, and lead aVF)
to be interrogated, and makes sense to my feeble ED brain from a "views" perspective.
Observe: an ECG from a paramedic crew
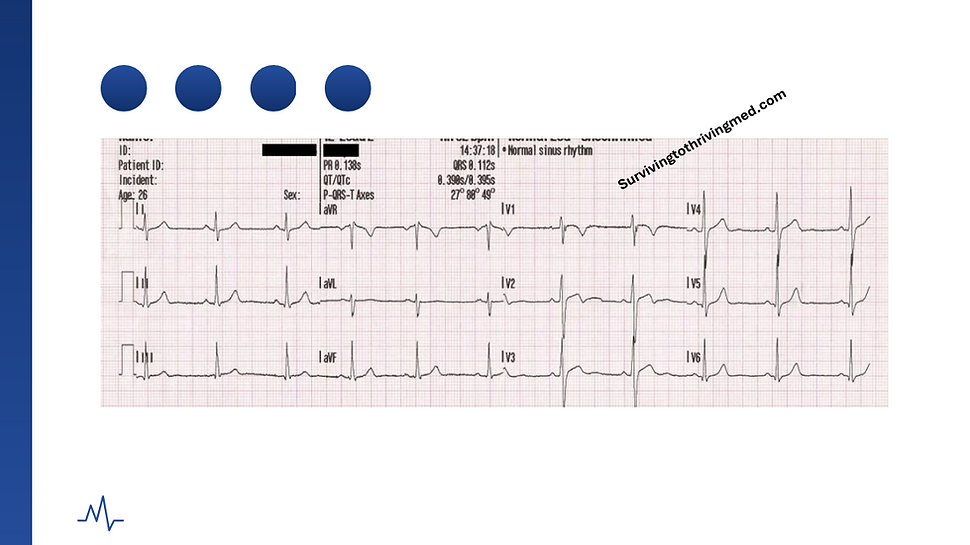
Lead 1 and aVF are both +ve waveforms.
From the prior section, one hopes the candidate by now understands this simply means that the QRS complex is predominantly above the baseline in that particular lead.
This is as opposed to say, aVR where it is a -ve waveform as it is beneath the baseline

As leads I and aVF are both +VE.
The wave is therefore heading "towards" them (blue arrow)
The vector must thus be heading in the direction in which both leads "see" a positive waveform.
This is the overall vector - (red arrow)
Here is another example:


Again, revisiting our two leads:
Lead 1: +ve
Lead aVF: -ve
Therefore, the wave is heading towards lead 1
but the wave is heading away from lead aVF.
This therefore results in the following visualisation:

This is therefore (possible) left axis deviation.
The author has prepared the following to consolidate the candidates understanding of the above.
The author presumes the candiate has their own crayons.


Answers as below:
With respect to lead 1 being +Ve, and lead aVF being -ve, whether or not this is "physiological" or "pathological" left axis deviation relies upon the extent of the deviancy.
Deploying artistic license:

The coloured in zone is normal and of no consequence, but between -30 (aVL) and -90 is.
How do we figure this out then?
We refer to lead II. (The author apologises for springing the necessity of 50% more leads than advertised to calculate an axis)
Hopefully by now the candidate appreciates the concept of "positive" and "negative" wave forms with respect to a lead.
They can thus appreciate how within the marked redzone above, this would appear to lead II as a "positive" wave form.
This is fine.
If lead II on the other hand is "negative" - then this means it is past the -30 mark, as follows:

This would condemn said ECG pattern under the remit of "pathological left axis deviation".
I therefore leave the reader with this present to consolidate their learning:

If you deploy what you have learned in this module, you will notice that the axis keeps changing.
If your attention span is extremely limited, you will instead be distracted by the enormous anterior complex changes which can be broadly summarised in surgical terms as the following:
"Bad."
This ECG, and many more interesting ones like it, will be explored in detail in my ECG course.
This includes detailed breakdowns, explanation of pathophysiology, and complex subject matter around treatment.
If, on the other hand, the candidates brain is melted by the concept of "positive" and "negative" with respect to the waveform being "up" vs "down", then the author invites the candidate to instead eat their crayons as a consolation prize, and consider applying for core surgical training.
Next up, Rate calculations.
Click for part 5:

bottom of page